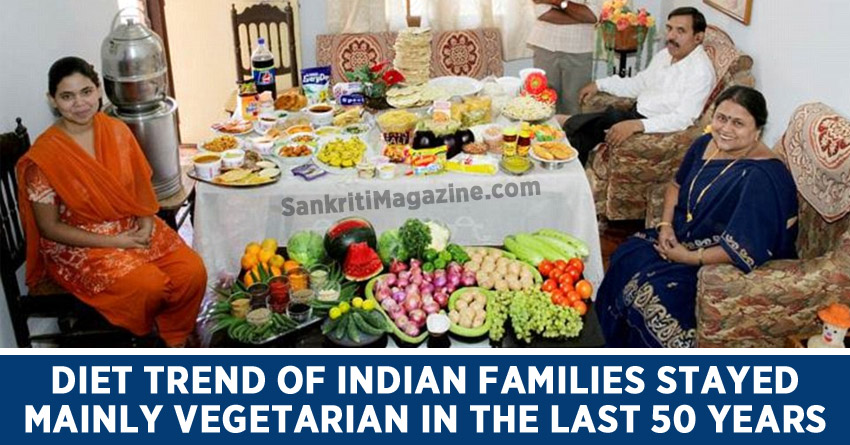
In the last 50 years, India’s population has surged, its food policies have been revised multiple times and the influence of western products on our eating habits has increased significantly, but the primary diet of Indian families has remained mostly vegetarian.
While our calorie intake has increased over the years and the sources of our vegetarian foods have changed, the percentage of meat consumption has not gone up comparatively. According to National Geographic, next to Rwanda and Ethiopia, Indians have consumed less meat per person than any other country.
According to United Nations’ Food and Agriculture Organization, any diet can be divided into the following 6 groups – grain (rice, wheat, maize, other cereals), dairy and eggs (eggs, milk, animal fats), plant produce (vegetables, fruits, starchy roots), meat (beef, pork, poultry, seafood, other meat), sugar and fat (sugar and sweeteners, vegetable oils, oil crops, sugar crops), others (pulses, alcoholic beverages).
Let us look at how the diet of Indian families changed in the last 5 decades.
In 1961, an average Indian family member consumed 2,010 calories in a day. It grew to 2,458 calories in 2011.
Here is a graphic that depicts our diet pattern during this time period: (INTERACTIVE)
According to the graphic, while our grain intake reduced from 63% to 57% (6 percentage points decrease) of the total intake in the past 5 decades, consumption of dairy, eggs and plant produce doubled. Our sugar and fat intake also increased by 3 percentage points.
However, our meat consumption remained the same – 1% of the total intake – in these 50 years.
It goes to show that as our economy gathered momentum, a part of our population started spending more on these products and spent less on grains.
Let us now compare India’s data with the world average.
In 1961, an average world family member consumed 2,184 calories in a day which grew to 2,874 calories in 2011.
Here is a graphic which depicts how the world ate in these fifty years. (INTERACTIVE)
Though grain intake reduced by 4 percentage points and plant produce and dairy and eggs intake went down by 1 percentage point each, sugar and fat consumption went up by 4 percentage points.
As per the graphic, the world meat intake increased from 6% in 1961 to 9% in 2011 – an increase of 3 percentage points.
Thus, as the economy grew in the past 50 years, families around the world reduced their consumption of grain, dairy, eggs, plant produce and started spending more on meat, sugar and fat intake.
At the same time, Indian families reduced only their grain intake and started spending more on dairy, eggs, plant produce, sugar and fats. And there was no change in our meat intake.
How Indians picked and dropped food items:
Grains
We saw previously that India’s grain consumption has come down by 6 percentage points. But not all grains were dropped from the plate by Indians. While rice and other cereals have seen a huge fall in consumption, Indians have consumed more of wheat. Consumption of wheat has seen an increase of 8 percentage points in these 5 decades.
Sugar and fat
We have seen that India’s sugar and fat consumption grew by 3 percentage points in the past 50 years. But this rise is entirely because of a huge jump in the consumption of vegetable oils. In 1961 only 5% of our diet consisted of vegetable oil, while in 2011 it grew to 9%. Other sources such as sugar, sweeteners, oil crops, sugar crops have remained the same throughout these years.
Plant produce
As mentioned before, India’s plant produce consumption doubled. This was mainly due to a marginal increase in the consumption of roots and fruits. There was a 2 percentage points increase in both fruits and starchy roots intake in 2011 compared to 1961.
Milk and eggs
While India’s dairy and egg consumption doubled, the intake of milk and animal fats went up by 2 percentage points in these 50 years.
Pulses
Our pulses consumption fell from 9% of the total intake in 1961 to 5% of the total intake in 2011.
And now what the world did:
Grains
South Korea’s grain consumption reduced from 82% of the total intake to 43% of the total intake in the past 50 years – an overwhelming 39 percentage points decrease. Due to the introduction of animal products and a huge jump in vegetable oil consumption, their grain intake seems to have taken a hit.
Sugar and fat
The Americans have always had more sugar and fat products in their diet when compared to that of other countries. About 37% of their diet in 2011 was sugar and fat. The North Koreans and the Vietnamese had the lowest sugar and fat consumption in 2011 – 10% of their diet.
Meat
Hong Kong’s meat consumption increased drastically than any other nation’s in these 50 years (by 19 percentage points). According to data collected by National Geographic, families there eat 60% more meat than the next highest meat-eaters in New Zealand. This is due to the dramatic increase in poultry and pork business in the 1980s.
Plant produce
The Chinese diet has always constituted the largest percentage of plant produce when compared to other countries. In 1961, about 23% of their total intake was that of plant produce – starchy roots were their favourite. But after 50 years, the Chinese plant produce intake has come down to 12% of their diet as they also started consuming more meat.
Milk and eggs
In 2011, 27% of the Somalian’s diet was milk – the largest split when compared to any other country. In the same period, Japanese lead the consumption of eggs in the world – 3% of their total diet.
Source: Food and Agriculture Organization, National Geographic